|
|
Andrew Andersen (Ed.) ETHNIC MAKEUP OF ABKHAZIA BEFORE & AFTER THE ETHNIC CLEANSING OF 1992-1993 |
|
|||||||||||||||||||||||||||||||||||||||||||||||||||||||||||
|
Leaving
aside dramatic changes of
Abkhazia’s population during the periods of Ottoman and Russian
expansion, as well as the complicated ethnic composition of the Apsua people
that included Adygh, Georgian and other elements,
we would like to offer you here an outline of Abkhazian ethnic history of the
20th century only. According
to the 1897 census, the ethnic makeup of the district of Sukhum
and the district of Sochi (that included a part of modern Abkhazia and
historically was often incorporated into it) looked as follows: |
|||||||||||||||||||||||||||||||||||||||||||||||||||||||||||||
|
The
district of Sukhum
Please note
that in some subdistricts Megrel
Georgians
were registered as Apsua due to the
confusing Russian concept of “Abkhazets” |
The
district of Sochi
Incl.
the town of Sochi
|
||||||||||||||||||||||||||||||||||||||||||||||||||||||||||||
|
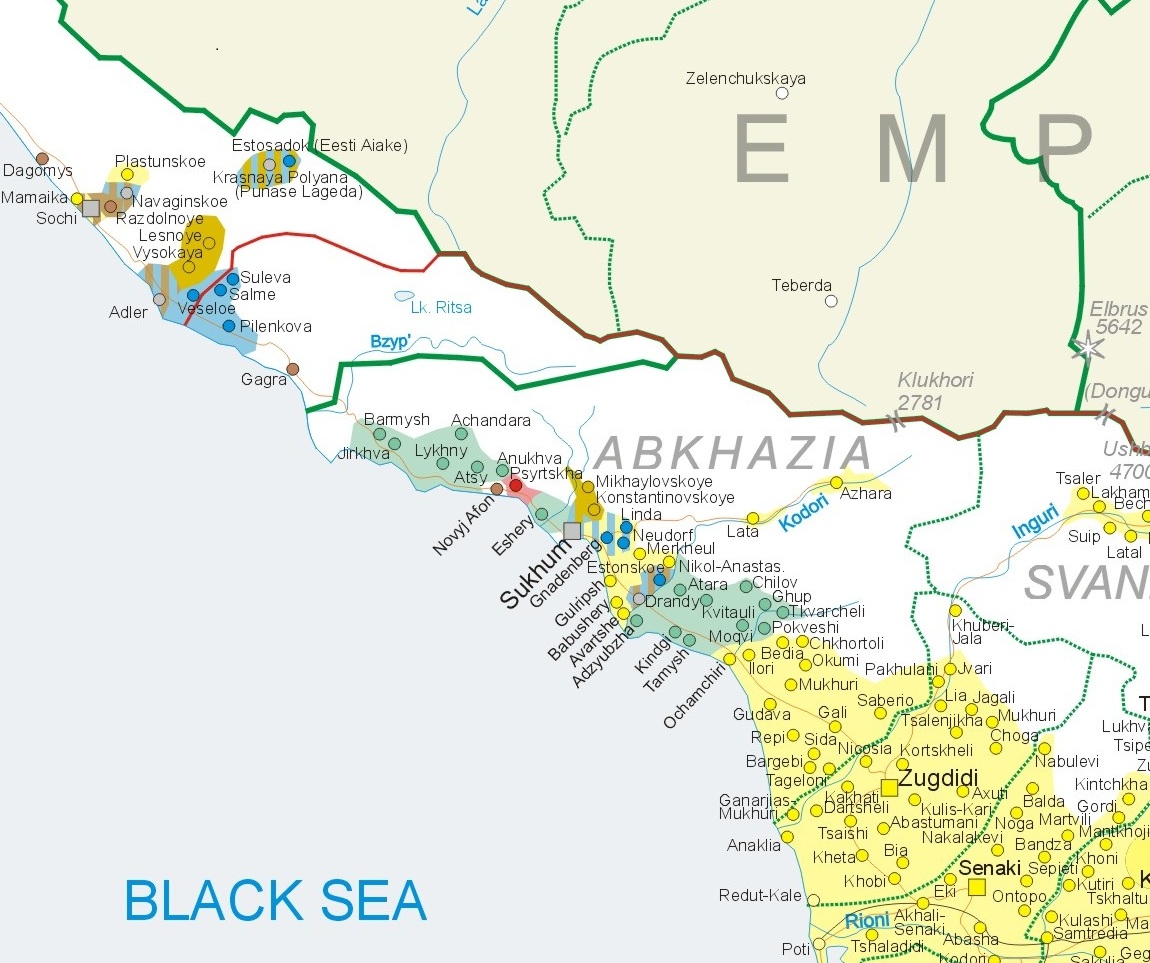
The below excerpt from the ethnic
map of the South Caucasus by Andrew Andersen and George Partskhaladze
based on the variety of Russian statistics of the late nineteenth and early
20th centuries depicts rather complicated ethnic palette of
Abkhazia where predominantly Georgian settlements are lemon-colored and predominantly Apsuan
settlements are ghost-greenish. Pink color goes for Armenians, golden for
Greeks, light brown for Russians, and light blue for the settlements with
German and Estonian majorities.
Please
keep in mind that the above map does not show the variations of population
density which was much higher, for example, around Sukhum
and lower near Lykhny or Tamysh. The
population of the towns of Sochi and Sukhum also
increased dramatically but there are no data regarding its exact ethnic composition
prior to the beginning of the First World War. (NB:
Here we use the old turkified and russified names of some towns like, for example, “Sukhum” or “Tamysh” because
those were official place names in 1901-1918) |
|||||||||||||||||||||||||||||||||||||||||||||||||||||||||||||
|
Almost three years of Georgia’s independence and 58 years of
Soviet domination that followed, resulted in some changes in the ethnic
makeup of the province |
|||||||||||||||||||||||||||||||||||||||||||||||||||||||||||||
|
|
According to
01.01.1979 census
|
According
to 01.01.1992 census
|
|
||||||||||||||||||||||||||||||||||||||||||||||||||||||||||
|
|
The
below map shows ethnic composition of Abkhazia and surrounding districts of
Georgia, as of 1989. Please
click on it for better resolution
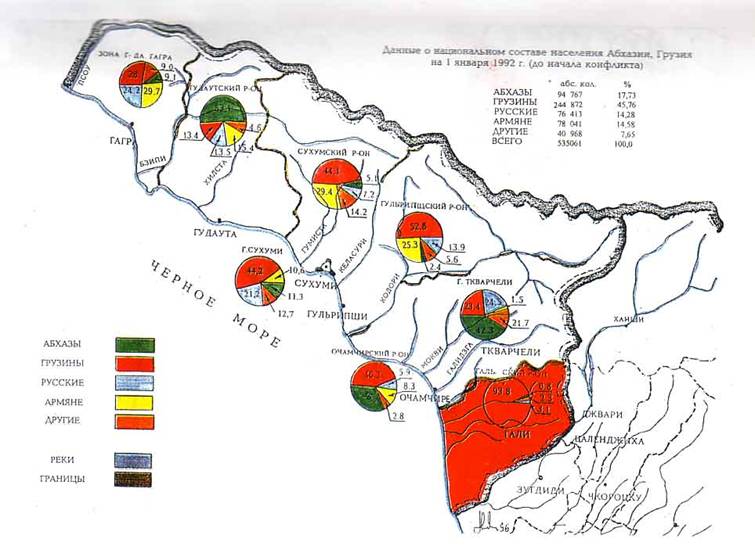
The
next map below (unfortunately, in Russian) shows ethnic composition of
Abkhazia’s 6 districts and two major cities before ethnic cleansing. The
“pies” clearly show that Georgians (red section) formed the largest ethnic
group except Gagra, Gudauta
and Tkwarcheli districts. In Gagra
ethnic majority was shared almost equally between Georgians an Armenians
(yellow section) whereas Apsua (green section) were dominant in Gudauta and Tkwarcheli. In the
district of Gali, Georgians formed almost 100% of
total population.
|
|
|||||||||||||||||||||||||||||||||||||||||||||||||||||||||||
|
|
|
|
|||||||||||||||||||||||||||||||||||||||||||||||||||||||||||


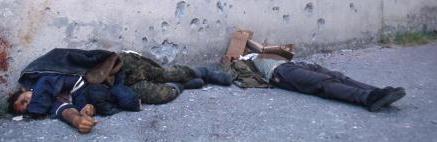
AFTER THE WAR AND ETHNIC CLEANSING OF 1992-1993:
|
The below results of 1997 census demonstrate the shocking decrease of
Abkhazia’s population from 535 061
in 1992, to 145 986 in
1997. That leaves Abkhazia with the total loss of 71% of its pre-war
population in spite of the fact that right after ethnic cleansing, Abkhazia
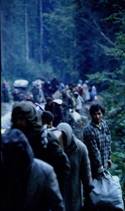
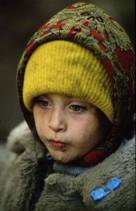
accepted thousands of immigrants from Russia, Turkey and Arab countries. More than half of Abkhazia’s pre-war population was massacred
or forced to flee to Georgia, Russia, Greece, Israel and other countries,
their property confiscated, re-sold or destroyed. In
many cases Georgians were slaughtered not only for their ethnic background
but for Georgian last names or “Georgian appearance”
|
|
|
|
According
to 01.01.1997 census
|
|||||||||||||||||||||||
|
|
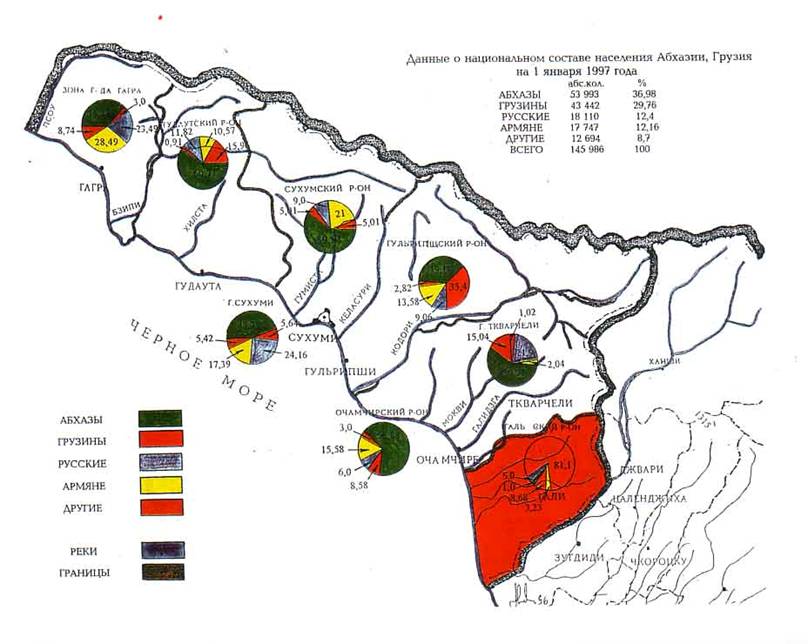
The
below map shows ethnic composition of Abkhazia’s 6 districts and two major
cities after ethnic cleansing. The
“pies” now show that Apsua (green section) became dominant in 4 out of 6
districts except Gulripshi
and Gali where Georgians are still the largest
group (red section) and in both the cities of
|
|
|||||||||||||||||||||||
|
|
|
|
|||||||||||||||||||||||
|
|
SOURCES: Andersen, A. and Partskhaladze,
G. Atlas of Contemporary
History of the South Caucasus: 1901-2008, In
print
Brook, S.,
Population
of the World, (Rus.),
|
|
|||||||||||||||||||||||